A New Hockey Stat, Adjusted Goals
Alexander Ovechkin might be closer to being the greatest NHL scorer of all time than we thought.
February 14, 2021
I’m a big fan of hockey, I’m not very good at playing it, but I’m a big fan of watching it.
And if you follow hockey as I do, you know there are constant debates about who is better than who; is Sidney Crosby (Pittsburgh Penguins, 2005-present) better than Connor McDavid (Edmonton Oilers, 2015-present), is Mario Lemieux (Pittsburgh Penguins, 1984-1997, 2000-06) better than Wayne Gretzky (Edmonton Oilers, 1980-88, Los Angeles Kings, 1988-1996, St. Louis Blues, 1996, New York Rangers, 1996-99)?
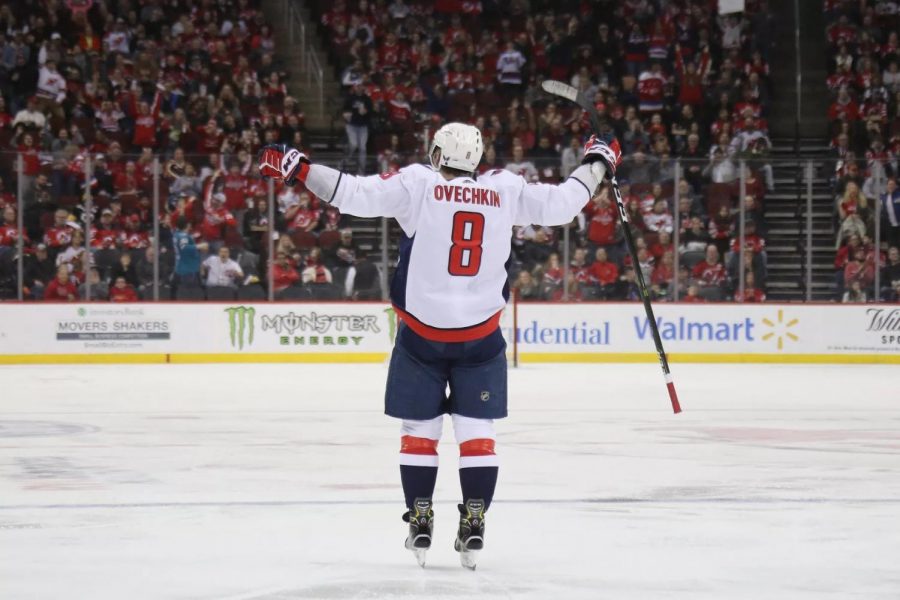
And something that comes up very often in these debates is the relevance of the era the player is playing in. One of the great questions of the sport right now is if Alexander Ovechkin (Washington Capitals, 2005-present) is the greatest goal scorer of all time?
Currently, he sits at 7th all time, with 711 goals, still 181 goals off of Gretzky’s record. The answer to this may seem like an obvious no, but then there becomes an interesting warping to this debate, when you look at the different eras of hockey that Gretzky and Ovechkin played in.
A term that will be thrown around quite often is the “Dead Puck Era,” similar to MLB’s “Dead Ball Era,” where scoring was down by a heavy margin. During the high-flying 80s, a team would score about 4 goals per game, on average.
When Alexander Ovechkin entered the league, teams were scoring about 3 goals per game, a whole goal less than those offense-heavy 80s, but even the season before he entered the league, teams were scoring at 2.57 goals per game (the increase from 2003-04 to 2005-06 can mainly be attributed to many different rules that favored offense that came in place after the 2005 lockout when owners and players could not agree on terms to keep the league going).
The Dead Puck Era is often referred to as the time between 1994-95 and 2005-06, although many would argue that it is still going on today, as the league has never quite reached those offensive highs of the 80s again. So, Gretzky played his prime when offense was at an all-time high in the NHL, Ovechkin played in his prime when goals were down by 1 per game on average (which does not seem like a lot, but would be 82 extra goals for a team in a season).
Other than goals per game, another stat to look at is Save Percentage, a stat for goalies that is the number of goals allowed divided by the number of shots faced, and then for some reason, divided by 100. So, if a goalie faces 10 shots, and allows 1 of those, he has a save percentage of .900.
When you compare the save percentage of the 1980s to the 2000s and early 2010s, the difference between these eras becomes even more shocking (for the purpose of this, we’ll go from the 1979-80 season to the 1989-90 season and the 2005-06 season to the 2015-16 season).
The average save percentage of a goalie in the 1980s was .877, for every 100 shots a goalie faced, he would let in about 12 of them. The average save percentage during that second period was .911.
That means, for every 100 shots a goalie faced he would let in only 9 of them, a huge difference between those two eras. On top of save percentage, you also have a player’s shooting percentage, which is goals/shots, the league average is around 9% these days, compared to 12% in the 1980s (it’s closely tied to save percentage, as you can see).
So, when people are debating if Ovechkin or Gretzky is better at scoring goals, how do they rectify these differences in eras? Well, I am here to help, because I have created a stat, called Adjusted Goals, that accounts for these differences.
What you do first, is find the player’s shooting percentage, and compare it to the League Average Shooting Percentage (LASP) of the season they played in, that way, you can find out how dominant of a shooter that person is over their peers, and then you multiply it by the LASP of the season that the other player played in, to find the player’s adjusted shooting percentage. Here is the formula:
(player shooting % / LASP) * LASP = Adjusted Shooting Percentage.
To find out how many goals the player would have scored in a different season, you take that Adjusted Shooting Percentage, and multiply it by the number of shots that the player took in their season, for this formula:
Adj. Shooting % * Shots = Adjusted Goals.
Using this, I took Ovechkin’s peak goal-scoring season in 2007-2008, where he was shooting 14.6% against a league average of 9.1%, and compared it to Gretzky’s record-breaking 1981-1982 season.
Ovechkin was shooting 1.6 times the league average in 07-08, and bringing that back to 1981-1982, he would have shot at 20.32%, against his 446 shots. That brings him to 90.6 adjusted goals, 1.4 short of Gretzky’s record.
Gretzky’s stats in 81-82 would bring him to a 17.836% shooting percentage in 2007-2008, which, against 290 shots, brings him to 65.99 adjusted goals, just one over Ovechkin’s total from that year.
The biggest outlier in this was Pavel Bure (Vancouver Canucks, 1991-98, Florida Panthers, 1998-2002, New York Rangers, 2002-03), who shot at an insane 29.5% in eleven games in 98-99 (obviously a terrible sample size, but still fun to look at), adjusting that to 81-82 and putting that against his highest shot total bring him to 165 G in 1981-82. If he were to take as many shots as Ovechkin did, he could have had 216 G, 1 more than Gretzky’s POINTS record.
There are some problems with my method, including that perhaps Ovechkin would have had more shots than he does now because of the lower quality of defenders in the 1980s, or that Gretzky could have had more shots because of fewer penalties being committed (although Gretzky was basically untouchable on the ice), but it provides a new look on one of the sport’s great debates, and it certainly shows Ovechkin to be closer on Gretzky’s tail than one might have thought.
Source: hockey-reference.com